Just because a website or practitioner states that there is "research" behind something, how do you determine if the research that has been conducted is in fact any good? While no means exhaustive, here's a good checklist to help you get you started. 1. Is the research question clear and informs us of its aims?
2. Is the study a systematic review or meta-analysis? These will provide the highest level of evidence as they evaluate the results of all available studies on the same subject. Ten or more studies with the same conclusion provides much better evidence than just one. While a randomised controlled trial that has been well conducted with a large sample size is good, the more studies showing a positive effect, the more we can trust in the research. 3. How many participants are included in the study? Studies with a high number of subjects are always better than those with less subjects, as it’s more likely to be a better representative of the general population. For instance, a trial with 500 participants is much more likely to have a statistically valid conclusion than a trial with 20 participants. Unfortunately, in many horse studies this can be challenging, and there are many papers published that have less than 10 horses included. Be wary of basing too much emphasis on the results of small sample sizes. 4. How were participants recruited and were they randomised to groups? Participants should be randomly assigned to the experimental and control conditions (e.g., sealed envelope assignment or computer generated random assignment). Look also at how participants were recruited. The sample can be biased when researchers use volunteers, especially those targeted through social media or special interest groups. Those who volunteer to participate in studies do not necessarily represent the general population, as they will often be people who already have an interest or bias towards the study subject. 5. Is the study blinded? Trials should involve blinding, meaning that researchers, experimenters, subjects, and assessors should not know which group subjects are in during the experiment. Say for example one of the measurements in a study was lameness of the horse. If the person assessing the lameness was aware of which horses had been in the treatment group and which horses were in the control group, there is an increased risk of bias in their assessment of that lameness (i.e. they may be more inclined to “see” an improvement in the horses they know had the treatment). 6. Is there a good description of the methods used? It should clearly state in the methods if subjects were randomised to groups and whether the subjects and assessors were blinded. If the information is not included this can suggest that the trial’s methodology is unknown (or the researchers are purposefully leaving it out) and therefore may be questionable. 7. Was there a control group? Without one it’s very difficult to conclude that the results were due to the intervention applied. 8. Is there risk of bias? This can include:
9. Does the study have validity? A study should have 3 different types of validity. These are:
10. Where was the study published? A study published in a well-known and respected journal will always be preferable to one published in an unknown publication. A “study” that has only been published on the website of the manufacturer who developed the product being researched should always been viewed with scepticism. An impact factor is a measurement that shows how often articles within a journal have been cited by other articles. A higher impact factor means that studies published within that journal are more likely to be seen as important within their field. While a study published in a low impact factor journal isn’t necessarily going to be a poor, chances are it won’t have had the same level of rigorous review that a study published in a high impact journal will have been through. 11. Has the research been peer reviewed? Peer reviewed research has been evaluated by external experts with experience in the subject matter. It is considered higher quality. 12. Are there appropriate statistical methods? Statistics are complicated! Proper and accurate analysis of data requires appropriate statistical tests. The tests used to analyse the data must be appropriate for the type of study and the research question they are trying to answer. Any tables and figures should be clearly labelled. Ideally, effect sizes should be included throughout giving a clear indication of the variables’ impact. 13. Are the findings statistically significant and/or clinically significant? This can be confusing, but it’s important to understand the difference. Statistical significance indicates the reliability of the study results and quantifies the probability of the study’s results being due to chance. Clinical significance reflects the impact on clinical practice and refers to the magnitude of the actual treatment effect. The “P” value is frequently used to measure statistical significance. It is the probability that the study results are due to chance rather than to a real treatment effect. A statistically significant “P” value is usually 0.05 (or 5%). What a P < 0.05 implies is that the possibility of the results in a study being due to chance is <5%, and therefore more likely to be due to treatment effect (i.e. the treatment very likely is what made a difference). While there are established, traditionally accepted values for statistical significance testing, such as the P value, this is lacking for evaluating clinical significance. More often than not, it is the judgement of the clinician (and the patient/client/rider) which decides whether a result is clinically significant or not. This can include whether the change from having the treatment makes a real difference to the subject lives, how long the effects last, consumer acceptability, cost-effectiveness, and ease of implementation. For example, a study may show that an electrotherapy treatment demonstrated a statistically significant improvement in the appearance of a lesion in a tendon on ultrasound 3 weeks and 6 weeks post-treatment compared to a control group (who had the same type of tendon lesion but who did not receive the treatment). The clinical relevance of this study is the “treatment effect”, which looked at the time at which the horse returned to competition. The results showed that the treatment group returned to competition only 5 days earlier than the control group, which most researchers, clinicians and riders would agree is a clinically irrelevant “improvement” in outcomes. While the study may have shown that initially the tendon appeared visually to have been healing faster (statistical significance), there was actually no real difference between groups in the time that the horses were able to get back to competition (clinical significance). In this instance the cli 14. Is the conclusion appropriate? In the discussion and analysis of data, researchers should note whether findings are statistically significant and if they consider there is any clinical significance. They should be careful not to make the outcomes seem more relevant than they really are. It’s a common mistake to emphasise results that are in accordance with the researcher’s expectations while failing to focus on the ones that are not. Will it can be tempting to jump straight to the conclusion when reading a research paper, make sure you read the results carefully first to see if you draw the same conclusions yourself. Even in a well-designed trial, further research and affirmation of outcomes in equivalent studies are needed before trial outcomes can be accepted as factual. Limitations of the study should also be mentioned. 15. Last but not least, were the ethical standards met?
0 Comments
The Goldilocks principle when applied to training loads in rehab is basically what you would expect - training just enough to cause adaptive changes, but not enough to cause injury. You should feel like you’ve worked but recover within 24-48 hours (JUST RIGHT). Soreness that lasts longer than 48 hours suggests you need to back off a little (TOO HOT), while no soreness or feeling of effort suggests you need to push a little more (TOO COLD). However, when our horses can’t tell us if they are sore or not following training, how do we enough if what we are doing is “just right”? For this post, we are applying these principles to injury management and rehab. Similar principles for training and performance can apply, but it’s a little more complex depending on your sport and your level. But essentially, we know that for regular training we need to train at a consistent level that increases gradually in order to improve. Sometimes we will have larger increases in training load (such as during competition or clinics) and sometimes we will have decreases (light work days or holidays/spelling). The body can cope with these well, as long as we have kept up training at an otherwise consistent level on all the other weeks. When it comes to injury management and rehabilitation though, often we see people training themselves or their horse in the ‘too cold’ zone, either by training not enough, not long enough or at too low intensity. While we have to be mindful of not doing too much and allowing the injured tissue to recover, it’s important to remember that the body and its tissues require load in order to heal. One of the most important concepts in orthopaedics in this century is the understanding that loading accelerates healing of bone, fibrous tissue, and skeletal muscle. Ever had a knee or hip replacement? If so you’ll know those pesky physios want you up and walking on day 1! Those of you who have had episodes of back pain will know that you usually feel worse lying in bed and that getting up and doing some gentle exercise typically makes you feel better. That's because the human (and horse) body is adaptable and transformable, it's not like a machine that simply breaks down. Signs your horse may not be working hard enough will simply be that you are seeing little to no change in their injury recovery, muscle development or movement (NO CHANGE = TOO COLD). Signs that you may be doing too much will be increased resistance to training, behavioural changes, lameness, heat or swelling that doesn’t go away after 24 hours or persistent pain response on palpation of the affected area (NEGATIVE CHANGE = TOO HOT). It’s important to note that sometimes this will occur if there is an underlying issue in the recovery and in these cases you should always seek veterinary advice. But if your horse appears to be gaining muscle, is moving better and seems happier in their work, chances are you’re getting the loads “just right” (POSITIVE CHANGE = JUST RIGHT). However, this can be difficult to achieve, and you will have ups and downs.
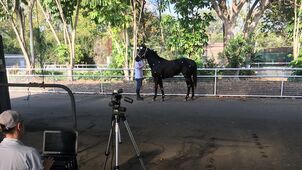
We next assessed her using high-speed video and 2D kinematic analysis. She again measured quite symmetrically comparing joint range of motion between the left and right limbs, suggesting that there were unlikely to be any underlying soundness issues. It was when we looked closely at her stride characteristics that we were able to identify some things that may have been limiting her performance. 1. Diagonal Advanced Limb Placement This refers to the placement of diagonal forelimb and hindlimb in trot and canter. The USDF's Glossary of Judging Terms defines it as being when the “hooves of a diagonal pair of limbs (in trot or canter) do not contact the ground at the same moment." We found that the:
This demonstrates a negative diagonal advanced placement (each forelimb lands before its diagonal hindlimb pair). In dressage horses we know from research that a positive diagonal advanced placement (hindlimb landing 20-30m/s before forelimb) is important for propulsion of the hindquarters. While this has not yet been studied in racehorses, we hypothesised that a similar limb placement pattern would be important for propulsion in the racehorse, and thus performance. This is something we hope to study further in racehorses to examine the effect on performance.
Upon performing a physiotherapy assessment, we found that this horse had some loss of muscle bulk in her hindquarters, particularly the right hindlimb, along with some pain response around the pelvic region. She had a tendency to overuse the muscles in the shoulder and lower neck region to pull herself along rather than really push from behind. 2. Stride Frequency
In a study of thoroughbred racehorses tested at maximal speed, the best performers were found to have a stride frequency of 2.81 strides/sec at the gallop. Stride frequency is positively correlated with performance – ie the best performers have higher stride frequencies. We found that this horse had a stride frequency of 1.9 strides/second. 3. Ground Contact Duration Ground contact duration is defined as the time elapsed between the non-lead hindlimb contact and the lift off of the lead forelimb, expressed as a percentage of the total stride duration. In a study of thoroughbred racehorses tested at maximal speed, horses that won short distance races (<1400m) were found to have a longer relative ground contact duration (68%). Long distance winners had shorter ground contact durations (58%). Sprinters tend to have higher stride frequencies but longer ground contact durations to give more time for propulsion. This horse (a sprinter) had a ground contact duration of 69% which is similar to top performing sprinters. Looking at parameters such as these were really useful for the trainer to know, as several studies have found that stride parameters such as frequency and duration can be influenced by training. Based on these findings, the trainer of this horse was able to make any adjustments to her training as he felt appropriate. We also put in place an exercise program which focused on improving her hindquarter strength and symmetry. Not long after this was put in place this horse had 2 great runs, placing a very close second in both races! This type of analysis is not just beneficial to racehorses, but for horses of all disciplines. Please feel free to get in touch to discuss in more detail how we can use gait analysis to assess your horse's performance. You may have heard of our gait analysis services, but do you know when it would be actually useful for you to utilise this service?
|
Archives
December 2020
Categories |